Contents
What are Perceptual Maps in Marketing?
A perceptual map is a visual technique used by marketers to help understand how consumers perceive competing brands within a marketplace.
They are called perceptual maps because it maps the “perception” of consumers and how they understand the positioning of competing brands.
The word “perception” is used in marketing and consumer behavior and can be defined as:
- “the process by which an individual selects, organizes and interprets stimuli into a meaningful and coherent picture of the world”
In simple terms, it is the consumer’s understanding, knowledge, attitude, and view of a product or a brand. It does not map actual positioning; it maps how consumers perceive the position.
Find out more: The Perceptual Process
What is the Difference between Perception and Positioning?
As indicated above, perceptual maps map perception – not actual positioning – so what’s the difference?
To answer this, let’s look at an example of the banking sector. If we asked consumers which bank is the most secure, they may select Bank X. However, if we ask an accounting firm to do an analysis of the bank that is the most secure, they may identify that it is in fact Bank Y.
So, which one are we more interested in? As marketers, we are more interested in the consumer’s perception. This is valuable information to understand how consumers really think and perceived the various brands.
If there is a gap between consumers’ perception and true positioning (as per the bank example), then this would identify that Bank X’s marketing efforts have not successfully been able to effectively communicate with its target market, and suggests that the perceived positioning of Bank X needs to be improved.
Find out more:
- Difference between a Perceptual Map and a Positioning Map
- Different Types of Perceptual Maps
- Perception is Reality
How are Perceptual Maps Presented?
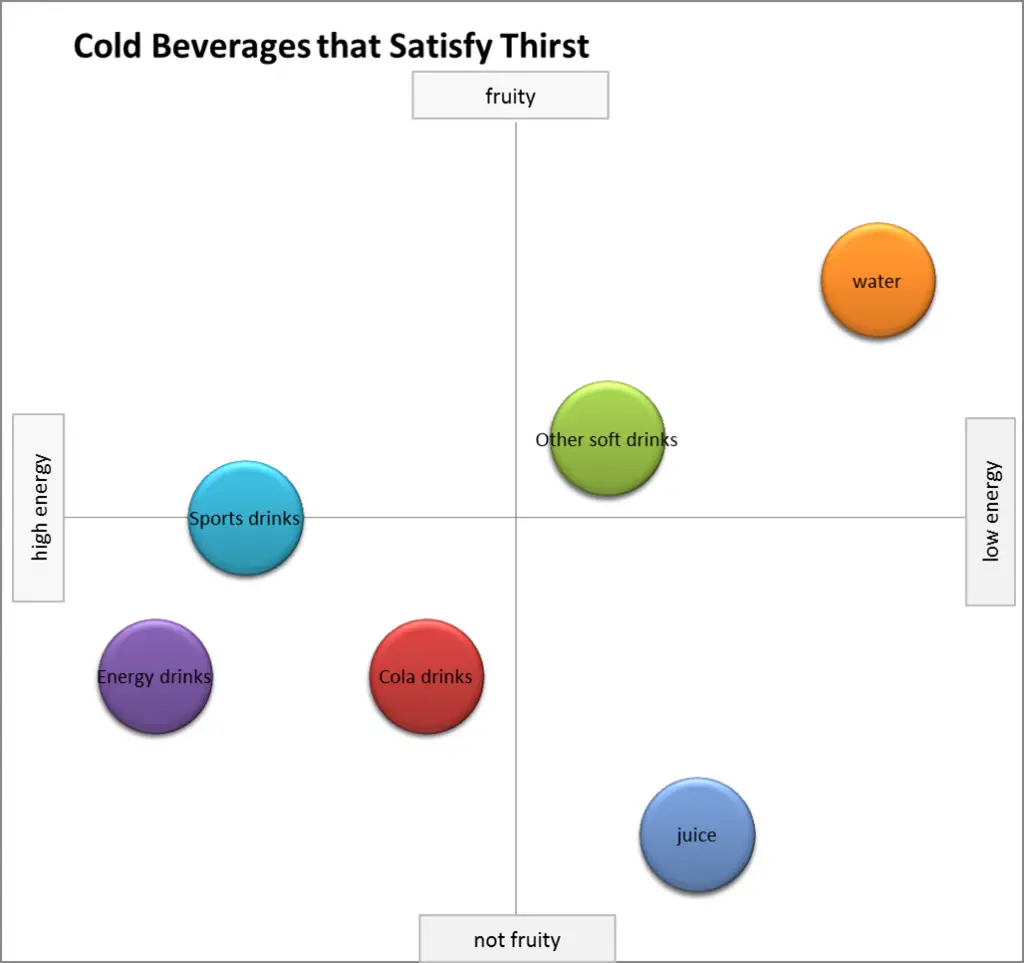
A perceptual map, in its simplest form, is presented on a two-axis scatter chart, as shown here. Each axis represents an attribute of the product that a consumer would use in choosing between competing offerings.

A perceptual map, in its simplest form, is presented on a two-axis scatter chart, as shown here. Each axis represents an attribute of the product that a consumer would use in choosing between competing offerings.
You will note that each attribute should be presented with opposite ends, for example:
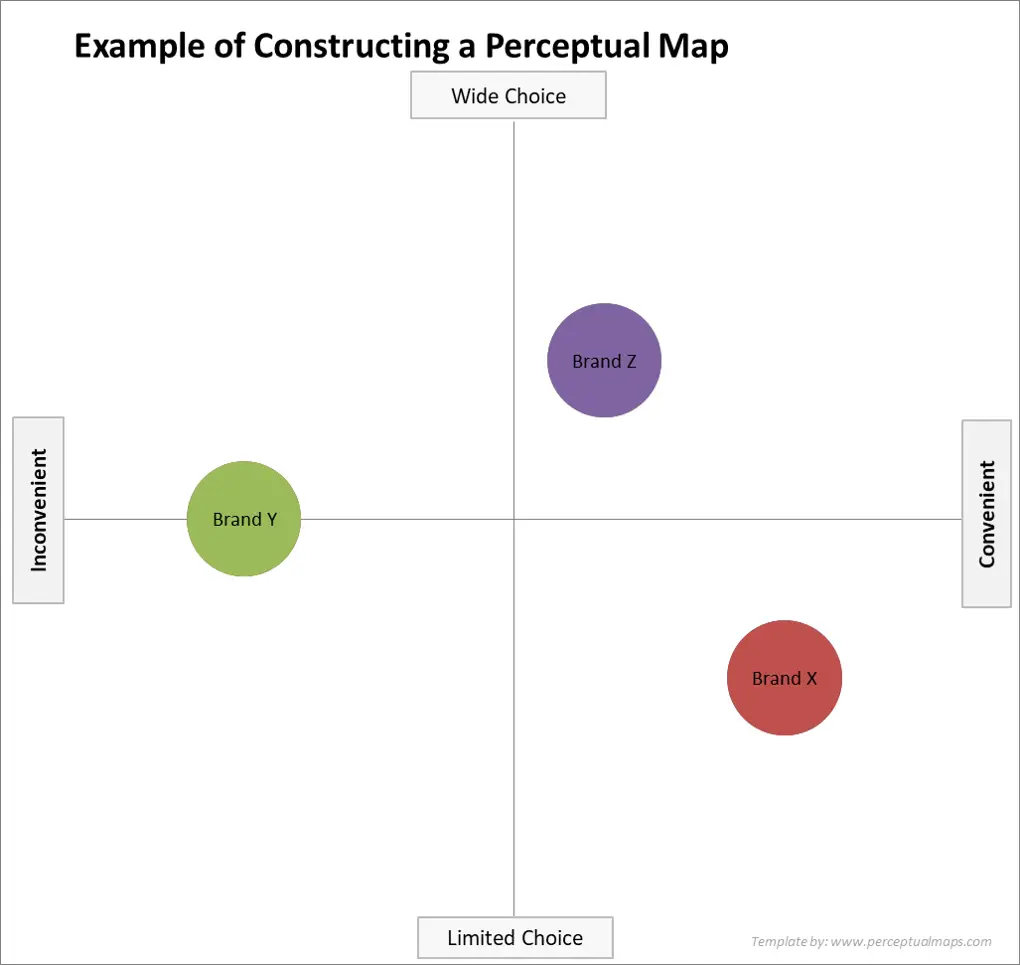
- Inconvenient to highly convenient
- Limited choice to wide choice
- Low energy to high energy (as shown)
- Not fruity to fruity (as shown)
This is a type of market research scale (using opposites) known as semantic differential scaling and has been identified as being a very effective and reliable tool in measuring attitudes and perception.
When companies undertake positioning and image market research studies, they will ask consumers about their perception of different brands using this scale. For example, on a scale of 1 to 9 how would you rate Brand X for an array of selected attributes, such as:
- Convenience
- Choice
- Great Taste
- And so on
This question structure is then repeated for each competing brand under consideration. We then end up with a series of attributes scored for each, as shown for these two attributes:


The perceptual map is simply the intersection of these two attributes because plot and onto a scatter chart, or a bubble chart, in Excel.
As you can see, Brand X was scored 8 for convenient and 3 for choice. Therefore, on the perceptual map, which is simply the intersection of these two attributes, Brand X is placed 8 across on the x-axis (convenient) and 3 up on the y-axis (choice).
Likewise, the other two brands are also plotted on the map accordingly. When you think about it, all that is happening is that with the two about attribute scales, the limited/wide choice scale has been place vertically against the convenient attribute (which remains in the horizontal position).
About Multi-dimensional Scaled (MDS) Perceptual Maps
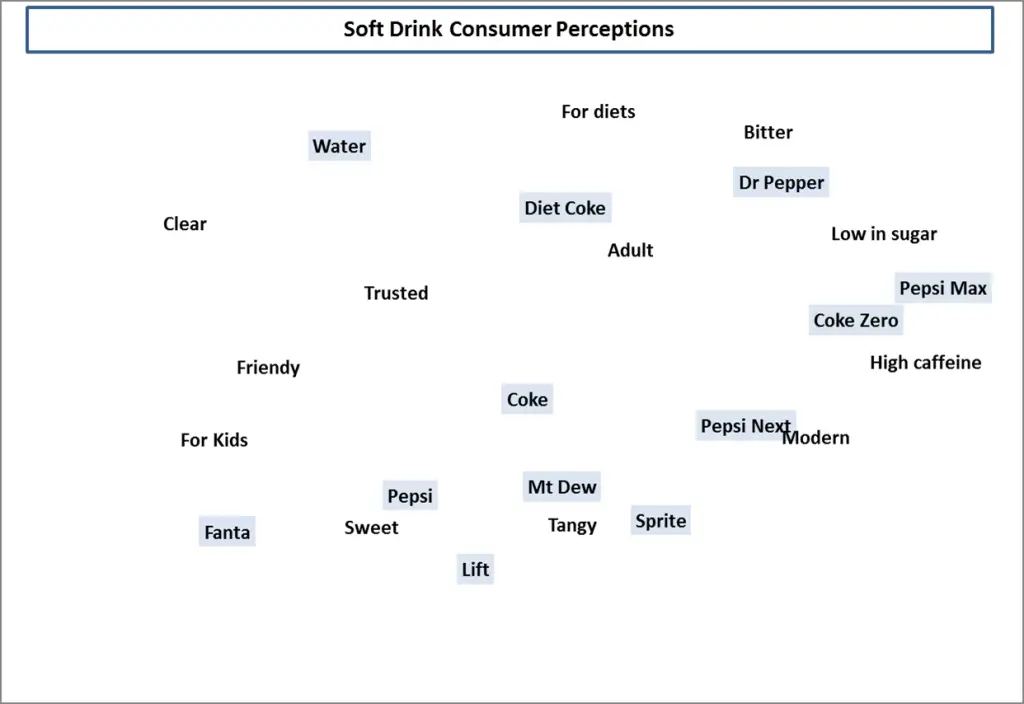
An alternative approach to the classic two-axis perceptual map is a multi-dimensional scaled perceptual map.
In this more complex perceptual map design, where the marketer places all attributes and all brands onto the same map at the same time.
These maps require an analyst to interpret the output and are helpful for understanding brand and attribute interrelationships. It also allows the marketer to understand the marketplace overall, which is a limitation of the traditional two-axis perceptual map.
Please see this article for more information about using multi-dimensional perceptual maps.
Which Type of Perceptual Map Should I Use?
Both variations of perceptual maps available and serve different purposes.
The standard two-axis perceptual map is designed to visualize image survey data and to communicate key findings from the study. In other words, it is an approach designed to highlight key findings quickly and easily. Typically, a marketer would use several different perceptual maps to illustrate interesting aspects of positioning in the marketplace.
Note: If you are a marketing student completing an assignment, you would most likely only be required to use the standard two-axis perceptual map.
A multi-dimensional scaled (MDS) perceptual map is helpful in presenting an overall analysis of the marketplace. It will provide additional insight that would be superior to the standard map in terms of the additional information that can be identified. However, it requires a statistical tool (please see the free Excel template for producing MDS perceptual maps on this website), and it is harder to read and interpret.
Note: If you are an analytics student or a marketer with image data from a consumer survey, it is recommended that both mapping techniques should be utilized in your analysis.
For more information: Different Types of Perceptual Maps
Can we Estimate a Perceptual Map Only Using Management Inputs?
Perhaps.
If the management team has a relatively good sense of how consumers perceive different brands, most likely gain from exposure from prior market research, that it would be possible for a management team to collectively construct perceptual maps that provide a reasonable estimation of consumer views.
In reality, there would be inherent bias of the management team towards their own brands and would hold certain competitors in higher or lower regard than would consumers. This means that a perceptual map construct by management could only be considered an estimation at best.
Therefore, whether it is a suitable approach depends upon the purpose of the perceptual maps. If it is designed for input into a significant and major marketing decision, then a perceptual map based on a real consumer survey would be recommended.
However, if the perceptual map is for additional information only, then it is appropriate that a management construct perceptual map would be used as this could be created quickly and without market research costs.
Do We Map Products or Brands?
A perceptual map can show the positioning of product or a brand quite effectively.
BUT…it is important to be consistent by either comparing products in the market OR brands in the market – not both. Mapping some brands versus some products would be problematic and would not be a logical approach.
Mapping brands make sense when comparing product categories where strong brands exist in the minds of consumers. For example, in the fast food sector, understanding the perception of McDonald’s versus Burger King versus Pizza Hut versus KFC and so on.
But mapping the perception of individual products within these fast food chains would probably not be overly insightful. It could be done, such as understanding the perceived differences between French fries at these different players, but unless that is a key attribute that consumers rely upon in choosing between these competitors it would be a relatively pointless exercise.
Whereas in supermarket products, drilling down to looking at individual product positioning would be helpful in understanding the market. For example, in the toothpaste product category, looking at precise competitors and the key attributes they are associated with, would help highlight how and why consumers choose between brands.
Quick FAQs for What is a Perceptual Map?
What are perceptual maps in marketing?
Perceptual maps are visual tools used by marketers to understand how consumers perceive competing brands in a marketplace.
How are perceptual maps different from actual positioning?
Perceptual maps represent consumer perception, while actual positioning refers to the objective evaluation of a brand’s attributes. Perceptual maps capture how consumers perceive brands, which may differ from the actual positioning.
How are perceptual maps presented?
Perceptual maps are typically presented as two-axis scatter charts. Each axis represents a product attribute, and opposite ends of the axis represent opposite values of the attribute.
What is semantic differential scaling?
Semantic differential scaling is a market research scale that uses opposites to measure attitudes and perception. It is often used in perceptual mapping to assess consumers’ perception of brands.
What are multi-dimensional scaled (MDS) perceptual maps?
MDS perceptual maps are more complex designs that incorporate multiple attributes and brands on a single map. They provide a comprehensive analysis of the marketplace and brand attribute relationships.
Which type of perceptual map should I use?
The standard two-axis perceptual map is suitable for visualizing image survey data and communicating key findings quickly. MDS perceptual maps offer more in-depth analysis but are harder to interpret and require statistical tools.
Can we estimate a perceptual map using only management inputs?
It is possible for a management team to construct perceptual maps based on their understanding of consumer perceptions. However, this may be biased, and a map based on real consumer survey data is recommended for significant marketing decisions.
Do we map products or brands?
Perceptual maps can show the positioning of products or brands effectively. However, it is important to be consistent and compare either products or brands, not both, to ensure logical analysis.
Further Reading
- Free Perceptual Map Maker Download Page
- Why Use Perceptual Maps?
- How to Analyze Perceptual Maps
- The Perceptual Process
- Benefits of Perceptual Maps
- Limitations of Perceptual Maps
- And check out the Market Segmentation Study Guide website

